
Open the browser console for troubleshooting
When technical support teams help users troubleshoot, they might need to dig deeper to investigate happening on a user’s computer. Getting a screenshot of the user’s browser console can help the team gather more technical information and identify the source of the error.
Users can follow these instructions to open their browser console.
Open the console
The browser console is a hidden panel that shows what’s happening on the website’s backend. It looks something like this when you open it:
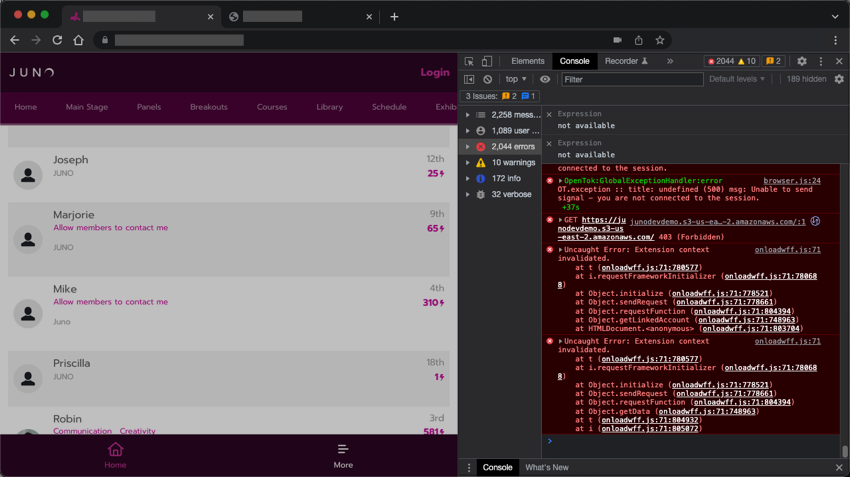
An example browser console.
Open it by following the instructions for your browser below.
Then the tech support team will help you take a screenshot that includes the right information. The large amount of text you’ll see can feel overwhelming, but they will guide you through it.
Go to the website page where you’re having trouble. Then press these keys on your keyboard together:
For Mac: Cmd + Option + J
For Windows: Ctrl + Shift + J
Or for either: Press F12
If that doesn’t work, try these steps:
Go to the website page where you’re having trouble.
Select the 3 dots icon in the top-right corner of the browser.
Hover over More Tools.
Select Developer Tools.

Go to the website page where you’re having trouble. Then press F12 on your keyboard.
If that doesn’t work, try these steps:
Go to the website page where you’re having trouble.
Select the 3 dots icon in the top-right corner of the browser.
Select More Tools.
Select Developer Tools.

Go to the website page where you’re having trouble. Then press these keys on your keyboard together:
For Mac: Cmd + Shift + J
For Windows: Ctrl + Shift + J
If that doesn’t work, try these steps:
Go to the website page where you’re having trouble.
Select the 3 lines icon in the top-right corner of the browser.
Select More Tools.
Select Browser Console.

Go to the website page where you’re having trouble.
Select the Safari tab in the menu bar at the top of the screen.
Select Preferences to open the preferences window.

Select the Advanced tab.
Check the box next to Show Develop menu in menu bar. This adds a new tab to the menu bar.
Close the Preferences window.

Select the Develop tab in the menu bar at the top of the screen.
Select Show Javascript Console.
